A survey on seafood procurement practices was conducted targeting restaurant owners and those responsible for ingredient sourcing.
Based on 1,301 responses collected, the results reveal that seafood procurement has become more difficult in all aspects, including volume, variety, and price.
Survey Results Summary
・95.2% of respondents reported that the volume of seafood distributed in the market has decreased compared to 10 years ago.
(Decreased significantly: 41.3% / Decreased: 53.9%)
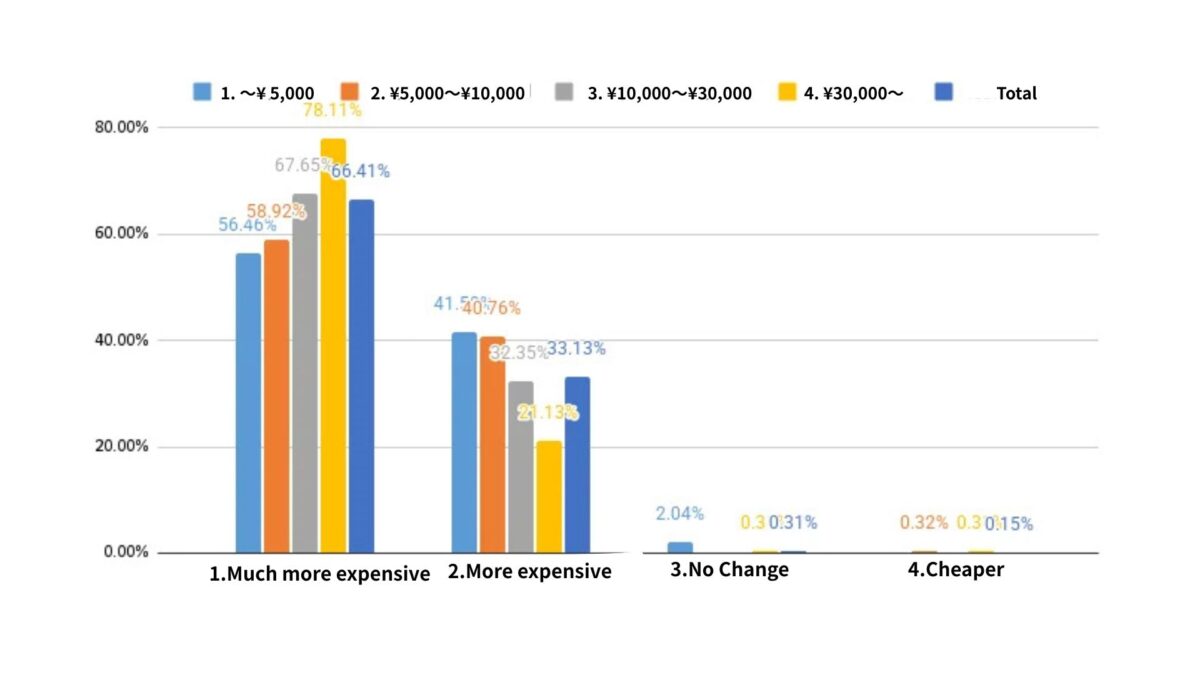
・99.6% stated that seafood prices have increased compared to 10 years ago.
(Increased significantly: 66.4% / Increased: 33.1%)
・Regarding the decline in volume and rising prices, higher-end restaurants reported feeling the impact more strongly.
(Among restaurants with an average customer spending of JPY 30,000 or more, 51.3% reported that volume had decreased significantly, and 78.1% reported that prices had increased significantly.)
・The seafood species most frequently cited as having worsened procurement conditions were:
1st: Squid 2nd: Sea urchin 3rd: Pacific saury 4th: Shrimp 5th: Octopus 6th: Abalone 7th: Mackerel 8th: Conger eel
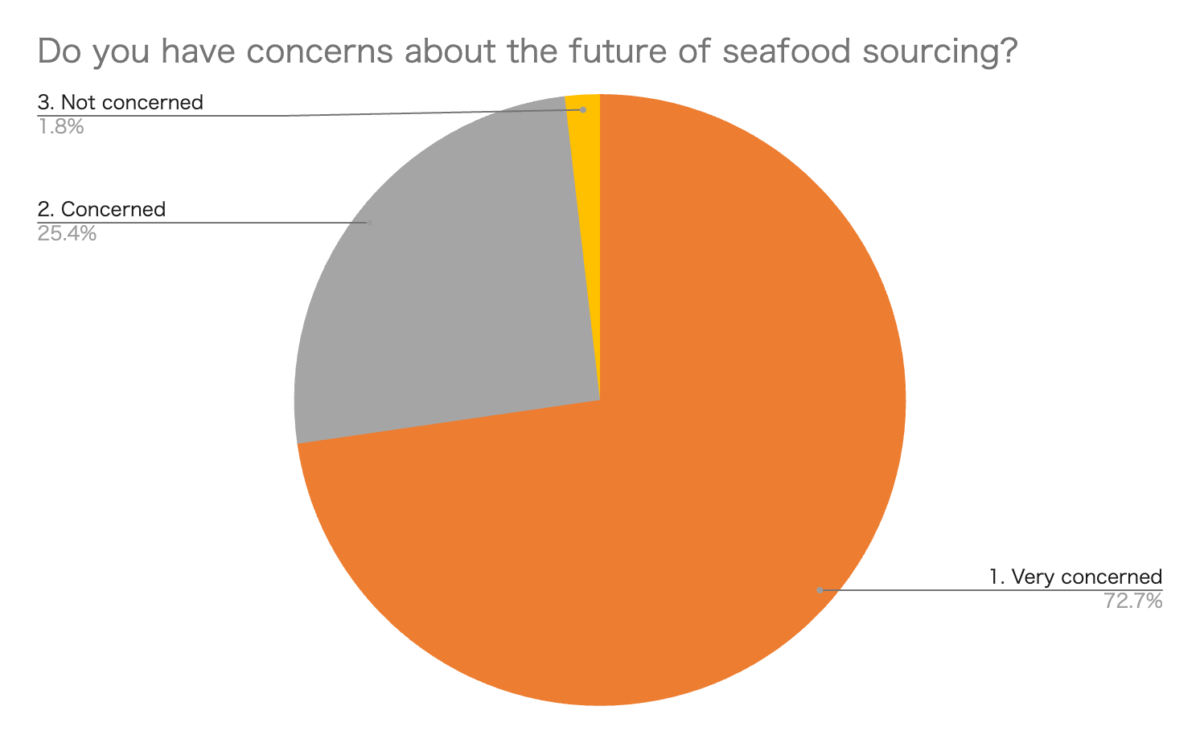
・98% of respondents expressed concern about the future of seafood procurement.
(Strong concern: 72.7% / Some concern: 25.4%)
【Comment from Hiroko Sasaki, Representative of Chefs for the Blue】
This survey has revealed that the situation surrounding seafood in restaurants has significantly deteriorated over the past decade.
With 98% of respondents expressing concern about the future, this situation can be described as nothing less than a crisis for Japanese food culture itself.
While climate change and the resulting shifts in marine environments are certainly major factors behind the recent decline in fish catches, they are not the only causes. Overfishing beyond the ocean’s productive capacity, coastal and river basin development, regime shifts (long-term cyclical fluctuations in stock levels observed in certain species such as sardines), and the reduction of nutrients supplied through rivers are all believed to be interacting in complex ways. These factors are affecting different species and regions in different ways.
To implement effective solutions, the first priority is to accurately understand what is happening in our oceans. However, Japan’s budget for fisheries resource surveys and stock assessments is less than half that of the United States, despite the U.S. having a smaller fisheries production value (*). Adequate funding for resource surveys, stock assessments, and research must be secured. To protect fish consumption—one of Japan’s most important cultural and natural assets—urgent action is needed to conserve and restore fisheries resources.
Furthermore, 99% of respondents indicated that they seek production-related information regarding fisheries resources. We hope that greater transparency—such as the disclosure of production histories and distribution information (traceability)—will be provided to restaurants and society at large. With improved access to such information, restaurants will be better positioned to source ingredients responsibly and develop menus that reflect sustainability considerations.
*Source: Chefs for the Blue research.
FY2023 Fisheries Production Value:
Japan: JPY 953.4 billion (marine capture)
United States: JPY 711.2 billion (commercial fisheries)
FY2025 Budget for Fisheries Resource Surveys and Stock Assessments:
Japan: JPY 9.8 billion (including related allocations)
United States: JPY 23.8 billion
Survey Overview
Number of valid responding establishments: 1,267
Survey period: May 15–29, 2025 (15 days)
Methodology: Online survey
Target respondents: Restaurant owners and food purchasing managers nationwide in Japan
Total responses received: 1,315 samples
Valid responses: 1,301
Change in the volume of seafood distributed in the market compared to 10 years ago:
95.2% of respondents reported that the volume has decreased.
A correlation was observed between a restaurant’s average customer spending and the proportion of respondents who reported that the volume had “decreased significantly.”
Among restaurants with an average spending per customer of JPY 30,000 or more, 51.3% stated that the volume had decreased significantly.


Change in seafood prices compared to 10 years ago:
99.5% of respondents reported that prices have increased.
A correlation was observed between a restaurant’s average customer spending and the proportion of respondents who reported that prices had “increased significantly.”
Among restaurants with an average spending per customer of JPY 30,000 or more, 78.1% stated that prices had increased significantly.

Species reported as having declined most significantly:
The most frequently cited category was squid, followed by sea urchin, Pacific saury, shrimp, and octopus.
(Based on the frequency of mentions extracted from open-ended responses.)

Sense of concern about the future of seafood sourcing:
98.1% of respondents expressed concern about the future of seafood procurement.